

|
Wave2000 Example #4:
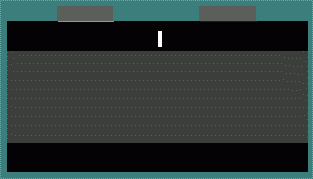
Pipe cross-section and Wave2000's model definition windows.This is an example designed to illustrate how Wave2000's graphical user interface makes it easy to setup a simulation model. Wave2000 can synthesize a variety of 2D objects. For example, one can create images with various geometries such as the "pipe with a crack" structure shown below. In addition, Wave2000 can import from many "paint type programs" so that there is basically no limit to the variety of complex structures which can be simulated with Wave2000. In this example, a Gaussian modulated 2.25 MHz waveform is transmitted into a brass pipe containing water, with a small crack (0.3 mm wide by 1 mm long) in the pipe located equidistant between the source (in green) and receiver (in blue).
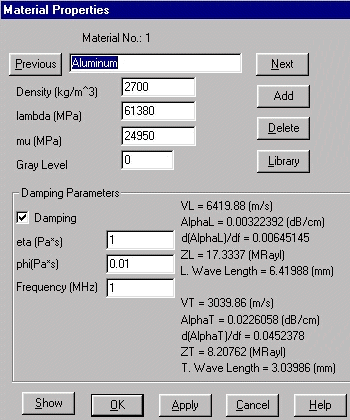
Wave2000 can simulate practically any material. By using the Materials Properties window shown below, you can specify the elastic constants of a particular material used in a simulation. One also specifies the grey level of the material which is to be associated with a particular region or set of regions in the object image. The familiar acoustic (longitudinal and transverse) impedances, velocities and attenuations are displayed at the bottom right portion of the page, associated with each material.
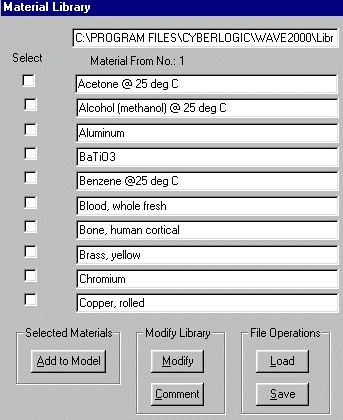
Wave2000 comes with a Material Library containing about 50 predefined materials. One page from that Library is shown below. You can also add materials to the Library, or create your own library or set of libraries.
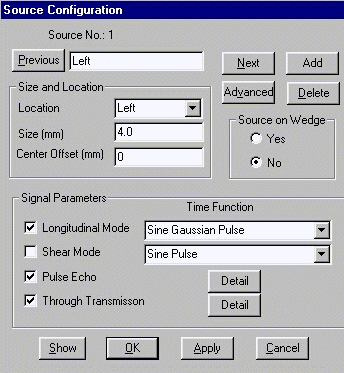
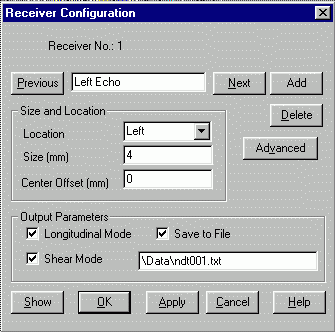
Wave2000 has an easy to use graphical user interface (GUI) for defining both sources and receivers, which the figures below respectively display. The commands, many of which are controlled by a single click of the mouse, can set up specific simulation conditions, as for example, with pulse-echo and/or through transmission definitions. Additionally, source waveforms can be chosen from a list of functions (including data from a user's own experimental measurements). Moreover, receiver data can be saved as an ASCII text file, for subsequent processing and analysis.
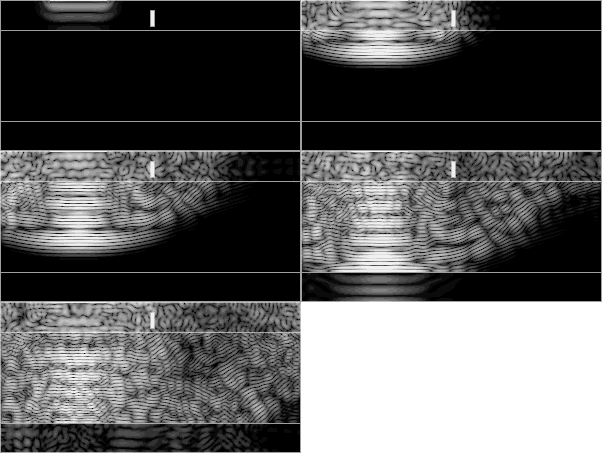
Simulation of the cracked pipe, which was set up using Wave2000's GUI in a matter of a few minutes, is shown below. This simulation can be useful for evaluating the effect of different size cracks (e.g., length and thickness) on the propagation of ultrasound down the pipe, from the transmitter to the receiver.
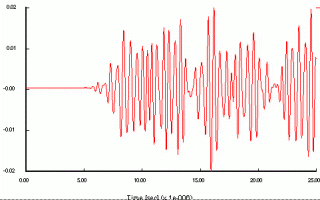
Data from simulations are plotted and saved to file. The longitudinal receiver measurements are displayed below. A similar plot (not shown) can be made for the shear measurements.
|
|||||||||
© 2024 CyberLogic, inc. All Rights Reserved